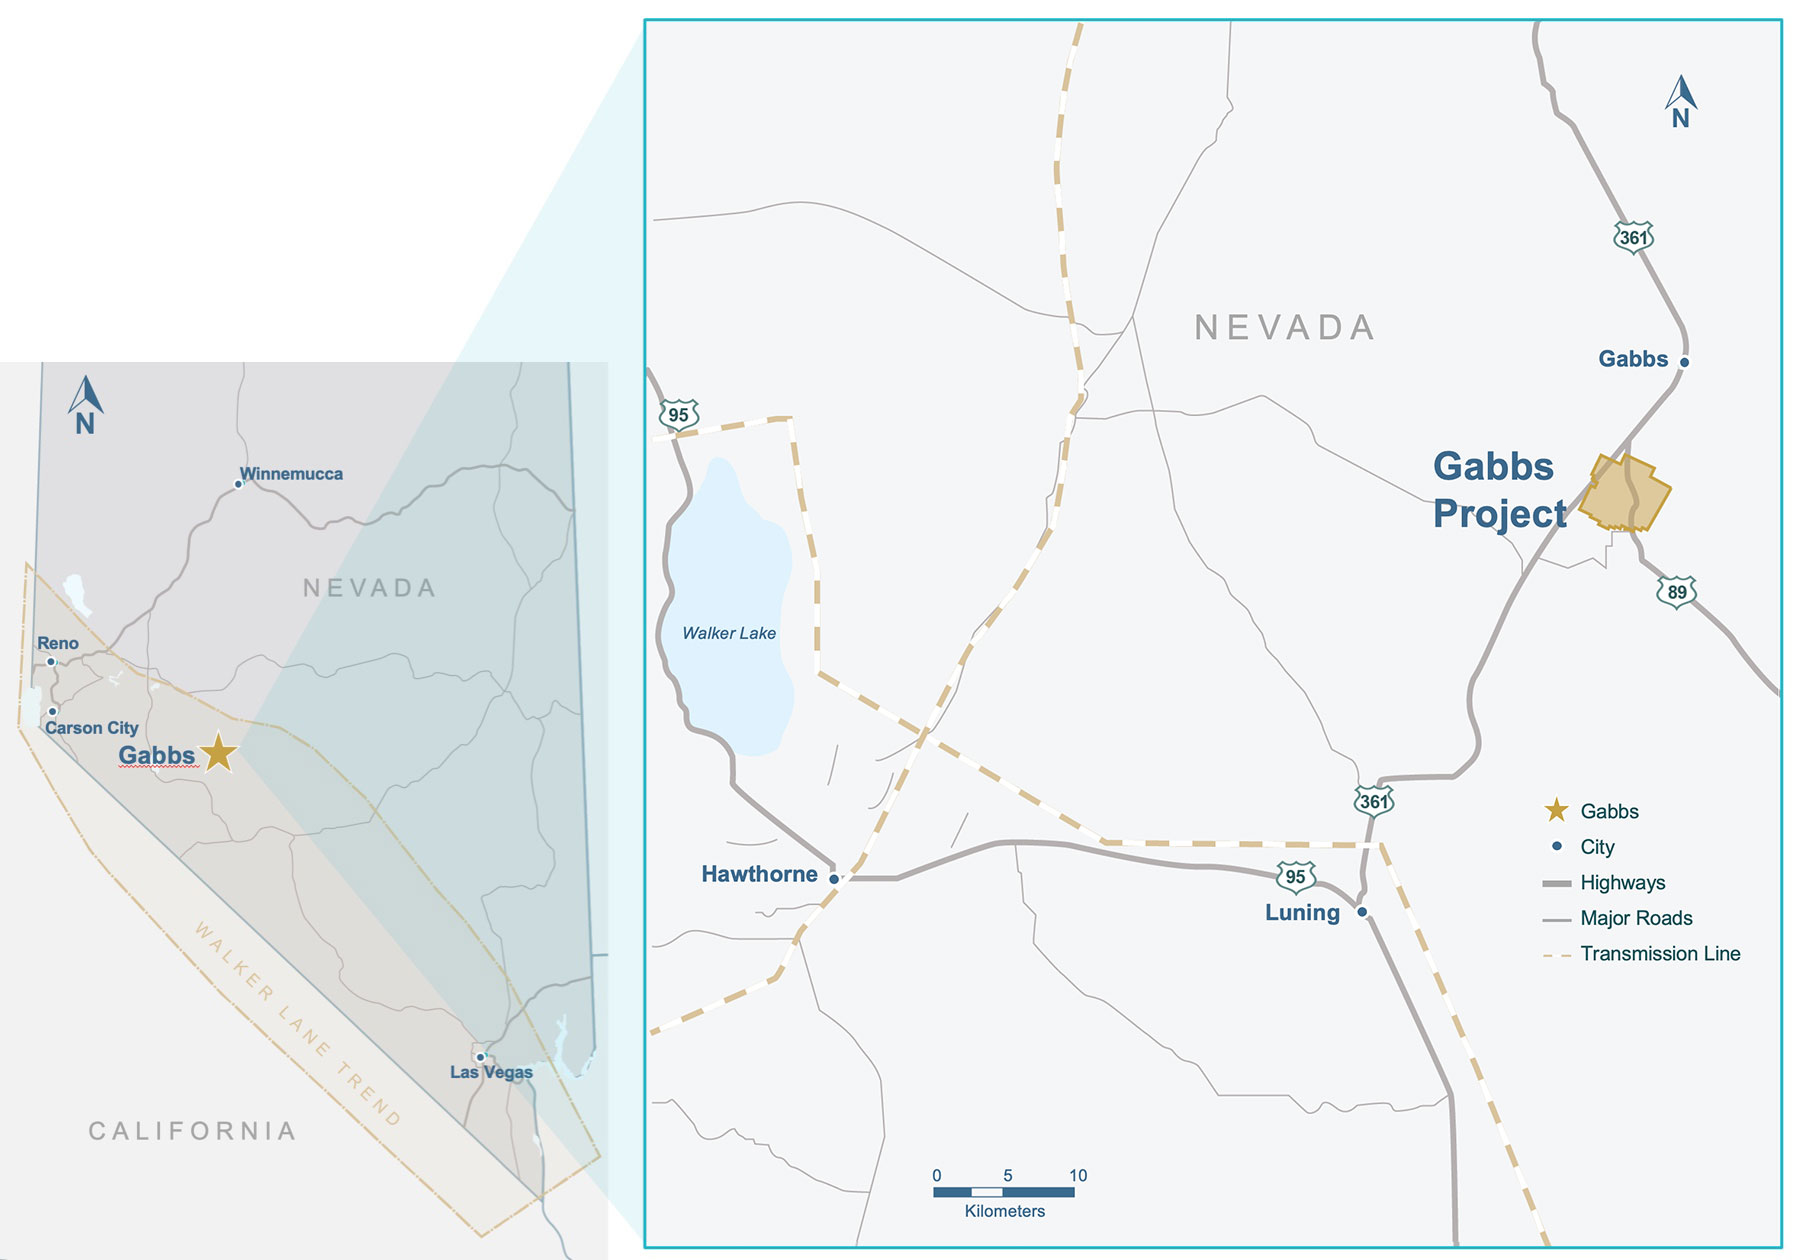
P2 Gold’s 100%-owned, gold-copper Gabbs Project is situated within the Walker-Lane Trend at the northwestern end of the Fairplay Mining District in Nevada, approximately 145 miles by paved road from Reno. In October 2025, P2 announced the results of a positive updated preliminary economic assessment (the “2025 PEA”) on Gabbs.
Mineral Resource
Gabbs has an Indicated Mineral Resource of 0.72 million ounces of gold, 2.17 million ounces of silver and 297.0 million pounds of copper (1.16 million ounces of gold equivalent at 49.8 million tonnes grading 0.45 g/t gold, 1.36 g/t silver and 0.27% copper) and an Inferred Mineral Resource of or 1.28 million ounces of gold, 3.04 million ounces of silver and 567.1 million pounds of copper (2.29 million ounces of gold equivalent at 112.2 million tonnes grading 0.35 g/t gold, 0.84 g/t silver and 0.23% copper). See Gabbs Project 2024 Mineral Resource Estimate below and P2’s news release dated April 29, 2024.
Property Description and Access to Infrastructure
The Gabbs Project is comprised of 543 unpatented lode mining claims and one patented lode mining claim covering four known zones of mineralization and comprising approximately 4,500 hectares (approximately 45 square kilometers or 16 square miles). P2 Gold owns a 100% interest in the Gabbs Project, subject to a 2% net smelter returns royalty payable to Franco-Nevada U.S. Corporation that it can repurchase at any time on payment of US$6.5 million. The company plans to repurchase the net smelter returns royalty after achieving commercial production at Gabbs.
Access to Gabbs is good, with paved Nevada Highway 361 and Gabbs Pole Line Road crossing the property. A powerline also crosses the property, and a major transmission line is located on the southern border of the property. An application has been made for a water permit, which is expected to be issued later in 2025.
Mineralization
The gold-copper mineralization at three of the known zones, Sullivan, Lucky Strike and Gold Ledge, is hosted within what are interpreted to be sills associated with an alkaline gold/copper porphyry. The gold mineralization at the fourth zone, Car Body, is interpreted to be low-sulphidation epithermal mineralization.
In late 2021 and early 2022, P2 completed a 48.3-line kilometer Natural Source Magneto Telluric (“NSMT”) survey at Gabbs covering all four known zones of mineralization and the prospective locations of a potential gold-copper porphyry source at depth. The initial interpretation of the three-dimensional NSMT inversion model has identified a high priority area in the center of the property that hosts a gold-copper porphyry exploration target. This area is below the Gold Ledge Zone and confirms the two-dimensional interpretation of the NSMT inversion model. An additional permit is required in order to drill the exploration target.
All zones on the property remain open and additional exploration targets, near surface and at depth, are drill ready. A drill has mobilized to Gabbs and infill and expansion drilling is underway at the Sullivan Zone.
Gabbs Project 2025 PEA
The 2025 PEA for the Gabbs Project was prepared by Kappes, Cassiday & Associates (“KCA”) of Reno, Nevada with Mineral Resource and mining contributions from P&E Mining Consultants Inc. of Brampton, Ontario in accordance with National Instrument 43-101, Standards of Disclosure for Mineral Projects (“NI 43-101”). (See news release dated October 7, 2025.)
2025 PEA Highlights
- After-tax net present value (5% discount rate) of US$2.253 billion and internal rate of return of 77.5% at US$3,885/oz gold, US$47.92/oz silver and US$4.81/lb copper (“Spot Case Metal Prices”) (See spot case to base case comparison in Table 1)
- After-tax net present value (15% discount rate) of US$946.0 million and internal rate of return of 77.5% at Spot Case Metal Prices (See spot case to base case comparison in Table 1)
- Total projected life-of-mine (“LOM”) after-tax cash flow of US$3.737 billion at Spot Case Metal Prices over 14.2-year mine life
- Total projected LOM revenue of US$8.152 billion at Spot Case Metal Prices over 14.2-year mine life
- LOM production of 1.547 million ounces of gold, 2.481 million ounces of silver and 213,000 tonnes (469.7 million pounds) of copper
- Estimated pre-production capital cost, including contingencies, of US$382.7 million with payback of less than one year at Spot Case Metal Prices
- For expediency and comparative purposes, the 2025 PEA uses the same mine plan as the May 2024 Preliminary Economic Assessment (the “2024 PEA”) based on metal prices of US$1,950/oz gold, US$25/oz silver and US$4.50/lb copper
2025 PEA Costs Update
Operating and capital costs were updated to August 2025 for the 2025 PEA.
- Mining operating costs increased by approximately 1%
- Mining capital costs, initial and sustaining, increased by approximately 7.25%
- Processing operating costs increased by approximately 14%
- Processing capital costs, initial and sustaining, increased by approximately 2%
Gabbs Project 2025 PEA - Economic Sensitivities
Table 1: Gabbs Project 2025 PEA Economics
| |
2025 PEA
Base Case |
2025 PEA
Spot Case(1) |
| Gold Price (US$/oz) |
$2,350 |
$3,885 |
| Silver Price (US$/oz) |
$29.00 |
$47.92 |
| Copper Price (US$/lb) |
$4.50 |
$4.81 |
| Net Revenue (US$) |
$5.594 billion |
$8.152 billion |
| After tax NCF(2) (US$) |
$1.713 billion |
$3.737 billion |
| After tax NPV(2) 5% (US$) |
$942.9 million |
$2.253 billion |
| After tax NPV(2) 10% (US$) |
$530.1 million |
$1.429 billion |
| After tax NPV(2) 15% (US$) |
$298.0 million |
$946.0 million |
| After tax IRR(2) (%) |
33.8% |
77.5% |
| Payback(3)/Mine Life (years) |
2.4 / 14.2 |
<1 / 14.2 |
(1) As of October 3, 2025
(2) NCF means net cash flow; NPV means net present value; IRR means internal rate of return.
(3) Calculated with preproduction capital, excluding mill and heap leach sustaining capital
Capital and Operating Costs
Table 2: Gabbs Project 2025 PEA Capital Costs
| Capital Costs |
(US$ in millions) |
| Mining (including contingency of 10%) |
$73.6 |
| Process, Heap Leach |
$213.1 |
| Other (including contingencies) |
$96.0 |
| Total Pre-Production Capital(1) |
$382.7 |
| Working capital and initial fills (heap leach) |
$12.5 |
| Sustaining Capital (heap leach & mill capital and contingencies) |
$350.9 |
| Sustaining Capital (mining and contingencies) |
$152.0 |
| Reclamation and Closure |
$56.4 |
(1) Sum differs due to rounding
Table 3: Gabbs Project 2025 PEA Operating Costs and AISC
| Operating Costs |
(US$) |
| Mining ($/tonne mined) |
$1.56 |
| Heap Leach Processing ($/tonne) |
$12.72 |
| Mill Processing ($/tonne) |
$14.59 |
| G&A ($/tonne) |
$0.74 |
| AISC (by-product)(2), LOM @ Base Case Metal Prices ($/ounce of gold) |
$1,284 |
| AISC (by-product)(2), LOM @ Spot Case Metal Prices ($/ounce of gold) |
$1,509 |
(1) Including rehandle material
(2) Net of silver and copper credits
Projected Mining and Production
Table 4: Gabbs Project 2025 PEA Projected Processing and Metal Production Summary
Year |
Tonnes
Process
Ox/S(1)(2)
(k) |
Gold
Grade
Ox/S(1)
(g/t) |
Silver
Grade
Ox/S(1)
(g/t) |
Copper
Grade
Ox/S(1)
(%) |
Gold
Production
(k oz) |
Silver
Production
(k oz) |
Copper
Production
(t) |
| 1 |
9,000/
- |
0.78/
- |
1.68/
- |
0.23/
- |
163.2 |
248.2 |
11,743 |
| 2 |
9,000/
- |
0.54/
- |
1.28/
- |
0.26/
- |
141.2 |
232.5 |
15,179 |
| 3 |
9,000/
- |
0.35/
- |
0.96/
- |
0.24/
- |
93.1 |
174.9 |
14,713 |
| 4 |
9,000/
- |
0.26/
- |
1.17/
- |
0.22/
- |
68.1 |
197.2 |
13,683 |
| 5 |
9,000/
- |
0.31/
- |
1.16/
- |
0.21/
- |
74.4 |
201.6 |
12,844 |
| 6 |
4,000/
5,000 |
0.52/
0.52 |
1.40/
1.27 |
0.22/
0.29 |
137.8 |
224.6 |
18,550 |
| 7 |
4,000/
5,000 |
0.35/
0.41 |
0.72/
1.09 |
0.19/
0.26 |
102.8 |
151.1 |
15,443 |
| 8 |
4,000/
5,000 |
0.43/
0.43 |
0.89/
1.20 |
0.23/
0.26 |
110.6 |
162.7 |
16,464 |
| 9 |
4,000/
5,000 |
0.47/
0.47 |
0.72/
1.20 |
0.26/
0.27 |
122.3 |
154.1 |
17,391 |
| 10 |
4,000/
5,000 |
0.36/
0.36 |
0.60/
0.90 |
0.25/
0.26 |
96.6 |
120.7 |
17,149 |
| 11 |
4,000/
5,000 |
0.25/
0.37 |
0.55/
1.08 |
0.23/
0.33 |
84.8 |
129.4 |
19,270 |
| 12 |
4,000/
5,000 |
0.51/
0.36 |
1.21/
1.11 |
0.16/
0.26 |
105.8 |
174.9 |
14,922 |
| 13 |
4,000/
5,000 |
0.67/
0.49 |
1.39/
0.95 |
0.21/
0.18 |
144.7 |
181.6 |
12,735 |
| 14 |
2,317/
5,000 |
0.20/
0.42 |
0.64/
0.85 |
0.14/
0.21 |
85.3 |
108.7 |
10,968 |
| 15 |
-/
1,028 |
-/
0.45 |
-/
0.88 |
-/
0.20 |
16.0 |
18.8 |
1,981 |
| Total |
|
|
|
|
1.547 (3) |
2.480 (3) |
213,035 (3) |
(1) Ox/S means oxide mineralization/sulphide mineralization
(2) Nominal tonnes
(3) Sums may differ due to rounding
Table 5: Gabbs Project 2025 PEA Other Mine Production Parameters
| Mining |
(M t) |
| Total waste tonnes mined |
399.4 |
| Total processed tonnes mined |
125.3 |
| Total processed tonnes mined Oxide/Sulphide |
79.3 / 46.0 |
| Total tonnes mined |
534.0 |
| Process Recoveries |
|
| Heap - Gold Recovery, Oxide |
85.0% |
| Heap - Silver Recovery, Oxide |
60.0% |
| Heap - Copper Recovery, Oxide |
67.0% |
| Mill - Gold Recovery, Sulphide |
94.5% |
| Mill - Silver Recovery, Sulphide |
50.0% |
| Mill - Copper Recovery, Sulphide |
79.9% |
Mining and Processing
Mining
The open pit waste and mineralized material will be mined by standard open-pit mining methods using an owner mining fleet of 136-tonne haul trucks and 15.3 m3 hydraulic shovels, fine crushed using a system incorporating a jaw crusher, cone crushers and high-pressure grinding rollers (HPGR).
Processing
Heap Leach
The Gabbs mineralized material is estimated to contain an average of 0.24% copper based on the mine plan used for the 2025 PEA. A portion of this copper is cyanide soluble and is expected to be extracted in the heap leach circuit. The cyanide soluble copper has an effect on the cyanide consumption. A SART (sulphidization, acidification, recycling and thickening) plant that releases cyanide associated with the copper cyanide complex, allowing it to be recycled back to the leach process as free cyanide is included. The resulting copper precipitate will be sold, bringing additional revenue to the project.
After the crushing circuit, the mineralized material will be agglomerated with cement and conveyor stacked on the heap leach pad in 8-meter lifts then single-stage leached with a dilute cyanide solution. The gold and copper bearing solution will be collected in the pregnant solution pond and pumped to the SART plant. Pregnant solution will be acidified with sulphuric acid, then copper will be precipitated as sulphides by the addition of sodium hydrosulphide. The precipitate will be thickened and filtered to produce a copper filter cake for shipment to a smelter. The barren solution from the SART plant will be processed in a carbon adsorption-desorption-recovery (ADR) plant to recover gold. The gold will be periodically stripped from the carbon using a desorption process. The gold will be plated on stainless steel cathodes, removed by washing, filtered, dried and then smelted to produce a doré bar. For the first five years, the heap leach circuit will operate at a rate of nine million tonnes per annum, in years six through 14 the heap leach circuit will operate at a rate of four million tonnes per annum.
Mill
The ROM feed material to the mill will use the same crushing circuit as the heap leach facilities. The mill feed will be crushed to P80 6.3 mm, (1/4”) in a three-stage crushing circuit, with the third-stage an HPGR. The milled sulphide product will be treated in a flotation plant to produce a copper concentrate suitable for sale. The flotation tailings will be thickened, then direct cyanide leached to dissolve gold, silver and copper. The leached solids will be washed in a CCD circuit to remove the dissolved metals and cyanide. The dissolved copper and silver will be recovered from the CCD overflow solution in a SART plant as a copper/silver sulphide precipitate. Regenerated sodium cyanide from the SART plant will be recycled to the leach circuit. Gold in the SART plant barren solution will be recovered in an ADR plant and refined to produce doré bars. The CCD tails are treated in a cyanide destruction circuit, filtered, and conveyed to a “dry stack” storage facility.
Opportunities
- Leach Cycle – complete studies to optimize the leach cycle time as the 2025 PEA contemplates 150-day leach cycle, while leach kinetics improved significantly with 98% of the gold, 90.1% of the silver and 85.1% of the copper recovered in less than 58 days under the Phase Three Metallurgical Program – a reduction in the leach cycle time will reduce the capex by reducing the size of the heap leach facility and amount and size of related equipment
- Metallurgy – complete additional test work to evaluate recoveries for sulphide gold mineralization and evaluate the use of HPGR for potential heap leaching of sulphide mineralization to increase recovery of free gold – if sulphide gold recoveries are sufficiently high, the mill facility may not be required, reducing overall capex
- Mine Plan – optimize mine sequencing to increase return on capital and carryout geotechnical drilling to optimize pit wall slope angles
- Waste Stripping - evaluate extent of alluvium in waste to reduce stripping cost
- Contract Mining - evaluate contract mining versus owner fleet
- Mineral Resource – expand oxide and sulphide gold and copper mineralization (zones remain open)
- Capex – evaluate equipment alternatives to reduce capital costs
SART Process - Background
The SART (sulphidization, acidification, recycling and thickening) Process provides for the economic processing of gold ore with high copper content. The process is based on the low solubility of copper sulphide (chalcosite) and the separation of copper-cyanide complexes at low pH to form copper precipitate and free cyanide. In operations, the pregnant solution (the cyanide solution with gold and copper) is treated with sulfide ion and sulphuric acid to lower the pH of the solution and precipitate the copper as copper sulphide and form hydrogen cyanide that remains in solution. Lime is then added to the solution to increase the pH of the solution to recycle the cyanide. Finally, the solution is processed to remove the gold. Once the gold is removed, the solution (with recycled cyanide) is used to process additional gold-copper ore.
Examples of Operating SART Plants:
- Yanacocha Mine – Newmont
- Lindero Mine – Fortuna Silver
- Çöpler Mine – SSR Mining
- Parral Mine – GoGold
- Telfer Mine – Greatland Gold
Gabbs Project 2024 Mineral Resource Estimate
The April 2024 Updated Mineral Resource Estimate (“2024 MRE”) was prepared by P&E based on four diamond drill holes and 27 reverse circulation drill holes completed by the Company in 2021 and 2022 and 494 drill holes completed by prior Gabbs Project operators between 1970 and 2011.
Table 1: 2024 Gabbs Project Pit Constrained Mineral Resource Estimate(1)(2)(3)(4)
Mineral
Resource
Classification |
Tonnes
(M) |
Gold Grade
(g/t) |
Silver Grade
(g/t)(5) |
Copper
Grade
(%) |
Gold
(M oz) |
Silver(5)
(M oz) |
Copper
(M lbs) |
Gold Eq. Grade
(g/t) |
Gold Eq.
(M oz) |
| Indicated |
49.8
|
0.45
|
1.36
|
0.27
|
0.72
|
2.17
|
297.0
|
0.73
|
1.16
|
| Inferred |
112.2
|
0.35
|
0.84
|
0.23
|
1.28
|
3.04
|
567.1
|
0.63
|
2.29
|
- Mineral Resources which are not Mineral Reserves do not have demonstrated economic viability. The estimate of Mineral Resources may be materially affected by environmental, permitting, legal, title, taxation, sociopolitical, marketing, or other relevant issues.
- The Inferred Mineral Resource in this estimate has a lower level of confidence than that applied to an Indicated Mineral Resource and must not be converted to a Mineral Reserve. It is reasonably expected that the majority of the Inferred Mineral Resource could be upgraded to an Indicated Mineral Resource with continued exploration.
- The Mineral Resources in this press release were estimated using the Canadian Institute of Mining, Metallurgy and Petroleum (CIM), Standards on Mineral Resources and Reserves, Definitions (2014) and Best Practices (2019) prepared by the CIM Standing Committee on Reserve Definitions and adopted by CIM Council.
- The Mineral Resource Estimate was prepared for a potential open pit scenario using a constraining pit shell (with 50 degree slopes) at respective 0.27 g/t and 0.36 g/t oxide and sulphide gold equivalent cut-off grades. The gold equivalent cut-off grades were derived from US$1,838/oz gold, US$3.96/lb copper, US$1.60/tonne mining cost, and US$11.40 and $19.60/tonne respective oxide and sulphide processing costs; US$1.00/tonne G&A cost, 78.3% and 95.2% respective Au oxide and sulphide process recoveries; and 48% and 78% respective Cu oxide and sulphide process recoveries.
- Silver not included in gold equivalent calculation.
Oxide Mineral Resources at Gabbs consist of Indicated Mineral Resources of 760,000 ounces of gold equivalent (33.7 million tonnes grading 0.46 g/t gold, 1.43 g/t silver and 0.26% copper) and Inferred Mineral Resources of 1,040,000 ounces of gold equivalent (52.0 million tonnes grading 0.39 g/t gold, 0.81 g/t silver and 0.21% copper). See Table 2 below for a breakdown of the oxide and sulphide Mineral Resources.
Table 2: 2024 Gabbs Project Pit Constrained Mineral Resource Estimate by Rock Group(1)(2)
| Rock Group |
Tonnes
(M) |
Gold Grade
(g/t) |
Silver Grade
(g/t) |
Copper Grade
(%) |
Gold
(M oz) |
Silver
(M oz) |
Copper
(M lbs) |
Gold Eq. Grade
(g/t) |
Gold Eq.
(M oz) |
Oxide
Indicated |
33.7 |
0.46 |
1.43 |
0.26 |
0.50 |
1.55 |
196.6 |
0.70 |
0.76 |
Oxide
Inferred |
52.0 |
0.39 |
0.81 |
0.21 |
0.66 |
1.36 |
243.8 |
0.62 |
1.04 |
Sulphide
Indicated |
16.1 |
0.43 |
1.21 |
0.28 |
0.22 |
0.62 |
100.4 |
0.77 |
0.40 |
Sulphide
Inferred |
60.2 |
0.32 |
0.87 |
0.24 |
0.62 |
1.68 |
323.3 |
0.65 |
1.25 |
Technical Report
The Technical Report in respect of the 2025 PEA on the Gabbs Gold-Copper Property has been filed on www.sedarplus.com.
View and download the Technical Report on the Gabbs Gold-Copper Project.
Qualified persons
The 2025 PEA was prepared by Carl E. Defilippi, RM SME and Caleb Cook of KCA and Eugene Puritch, P.Eng., FEC, CET, and Andrew Bradfield, P.Eng. of P&E Mining Consultants Inc. (“P&E”) of Brampton, Ontario, each of whom is a “Qualified Person” as defined by NI 43-101 and independent of the Company and has reviewed and approved of this technical content relating to the 2025 PEA.
The 2024 MRE was prepared under the supervision of Eugene Puritch, P.Eng., FEC, CET of P&E Mining Consultants Inc., who is an Independent Qualified Person, as defined by National Instrument 43-101. Mr. Puritch has reviewed and approved this technical content relating to the 2024 MRE.
Ken McNaughton, M.A.Sc., P.Eng., Chief Exploration Officer, P2 Gold, is the Qualified Person, as defined by National Instrument 43-101, responsible for the Gabbs Project. Mr. McNaughton has reviewed, verified, and approved the scientific and technical information relating to the 2025 PEA.
Historical Exploration
The Gabbs property is situated within the northwestern end of the Fairplay Mining District and has been intermittently explored by various operators from the 1970’s until 2011. Over half of the drilling during this period concentrated on the Sullivan porphyry gold-copper deposit. The mineralized zones at Gabbs had not been tested along strike or at depth, and of the 494 holes drilled at Gabbs between 1970 and 2011, 180 holes (36%) ended in mineralization. Also, a significant number of holes drilled prior to 2004 were, depending on the focus of the operator, assayed only for gold or only for copper, not both metals. Two pre-feasibility level studies were completed for Sullivan, in 1990 (by Gwalia Gold Mining) and 1995 (by Arimetco). Both studies were completed prior to the development of the sulphidization-acidification-recycling-thickening process (SART) for the recovery of oxide gold with copper. The most recent substantive exploration work on the property was completed by Newcrest from 2002 to 2008, which included geochemical and geophysical surveying and drilling. Newcrest decided in 2009 to divest its US properties and Gabbs was acquired by St. Vincent Minerals Inc. in 2010. Prior to P2’s 2021 exploration program, no exploration work had been undertaken at Gabbs since St. Vincent’s work in 2011.